“Port Details” View Explained
This window displays all the details about a specific port, such as issues, technologies, discovery method and path, and connected assets.
Go to the Ports window by clicking Ports from the vertical menu on the left. Click a particular port under the column Asset Name to see the details.
What Is in the “Port Details” View?
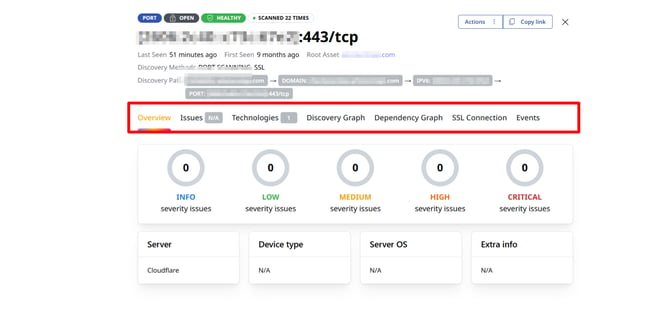
When you open the Port Details window, you will immediately see an overview of the port's main properties. These include:
- Port's name
- If the port asset is vulnerable or healthy
- The number of times it was scanned
- When it was last and first seen
- Its root asset
- The discovery method and path used to detect it
- The severity distribution of associated vulnerabilities
- Its associated server and corresponding OS, device type, and other technical information
- Tags, if the asset was tagged

More details about some of these port properties can be accessed in their respective tabs.
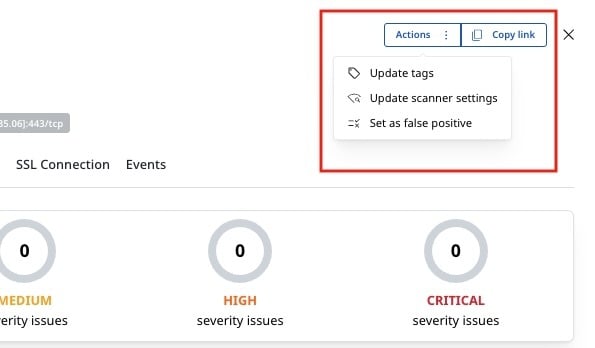
Users can also perform certain actions on the Port Details window, including updating tags or scanner settings, and setting the port as false positive. They can also copy the link to the specific port for easy sharing with colleagues.

On the left, there's the Activity Feed tab, where you can see the system events concerning the port and add comments.

What Tabs Are in the “Port Details” View?

Aside from Overview, which is the default tab, the Port Details window has the following tabs.
Issues
The Issues tab contains a list of all the security issues the port has or had. On this tab, you will see the issue’s name, severity, CISA KEV status, vulnerability status, affected assets, asset type, tags, root asset, and when the issue was last and first seen.

Technologies
The Technologies tab displays a list of technologies detected by Attaxion for the particular port. For each technology, you will see the name, version, end of support details, detected issues, number of assets, category, discovery method, and last and first seen dates. Clicking a specific technology reveals the assets connected to it and any associated issue.
.png?width=670&height=480&name=2%20(1).png)
Discovery Graph
The Discovery Graph tab helps visualize the path Attaxion took to discover the port, highlighting root and other connected assets.

Dependency Graph
This tab visualizes the relationship between the selected port and other assets. The graph is color-coded, with healthy assets in green and vulnerable ones in red.

SSL Connection
On this tab, you can find the port’s SSL configuration details, including protocols, cipher suites, session settings, and other technical information.
.png?width=624&height=475&name=5%20(1).png)
Events
The Events tab provides a chronological record of Attaxion’s interactions with the asset. This includes events like initial discovery, technology detection, scan attempts, and any error encountered.
