“Asset Details” View Explained
This view provides you with all the details about a particular asset, including its type and vulnerabilities, technologies, related assets, and more.
If you click on any asset from the “Assets” tab or on the graph, you’ll see a window detailing everything that Attaxion knows about this asset.
What is There in the “Asset Details” View?
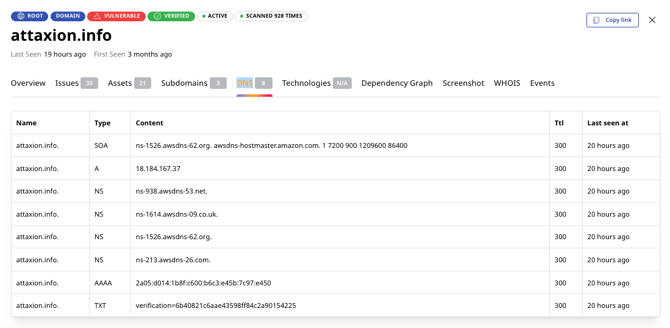
At the top, the “Asset details” view offers a quick overview of the main properties of the asset:
- Asset type (port, subdomain, domain, CIDR, or other some type of assets)
- Status: vulnerable or healthy
- How many times the asset was scanned
- Tags, if the asset was tagged
These are purely informational and not clickable.
And of course, there’s the asset’s name. For domains and subdomains, it’s the domain name, for SSL certificates, it’s their serial number, and so on. The asset name cannot be changed.

To the left, there's the Activity Feed which contains system events and comments. You can add a comment in the Activity Feed as well.
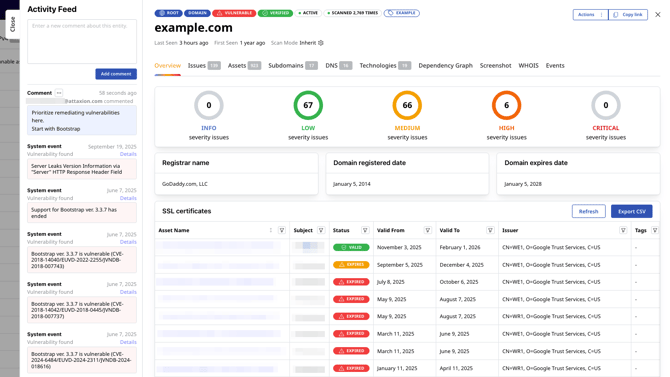
To the right, there are two buttons.
The "Copy link" button allows you to copy the link to share it with other members of your team. They’ll need to have access to your organization’s Attaxion instance to view it.
The "Actions" button produces a drop-down menu when clicked.

- Add or update tags (which you can then use to sort assets and which are visible in the “Assets” tab)
- Update individual scanner settings for the asset
- Set the asset as false positive. If the asset is set as false positive, it's removed from the list of assets and no longer scanned. You will still be able to find it in the "Archived Assets" section in the "Management" tab.
Below the name, you can see more information about the asset:
- When it was first seen (discovered by Attaxion)
- When it was last seen
- Scan mode
- The associated root asset
- The discovery method used to find the asset
- The discovery path – the steps that connect the asset in question with the root asset

Tabs in the “Asset details” view
Since there’s a lot of information Attaxion can get about an asset, the “Asset details” view offers several tabs to organize it.
Depending on the type of asset, there can be a different list of tabs.
Tabs that All Asset Types Have
Overview
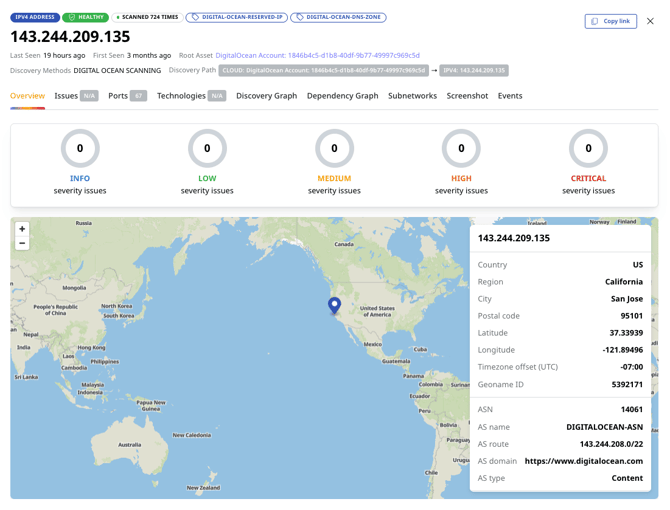
The “Overview” tab provides a quick overview of how issues that the asset has are distributed by severity.
It also gives an overview of the asset, providing some general data about it. For domains, it’s the registrar name and domain registration and expiration dates. For IP addresses, it’s a map with coordinates, country, and ASN data.
Issues
The “Issues” tab contains the list of all the issues the asset has or had. For each issue in the list, you can see its name, severity, CISA KEV status, status, the asset it affects and its type, asset tags, related root asset, when the issue was last seen and when it was first seen.
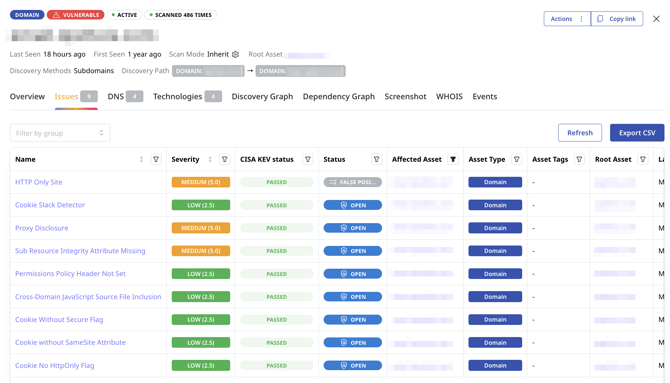
If you click on an issue in this list, you’ll see the “vulnerability details” view for this issue.
Technologies
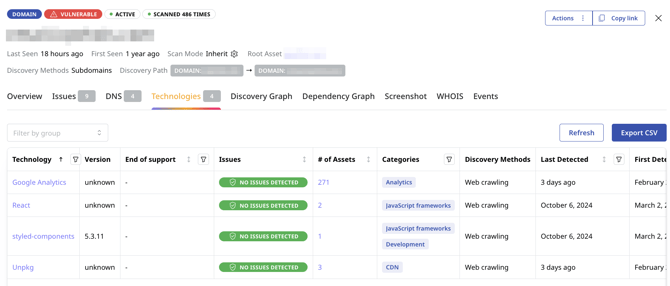
The “Technologies” tab shows you a list of technologies detected by Attaxion that are used on this asset.
For each technology listed, you can see it’s name, version, end of support, status (whether it has issues or it doesn’t), the number of assets in the organization’s external attack surface that technology version is used on, the technology category, discovery method, when it was last seen and first seen.
If you click on a technology in this list, you’ll see the technology details for this issue.
Dependency Graph
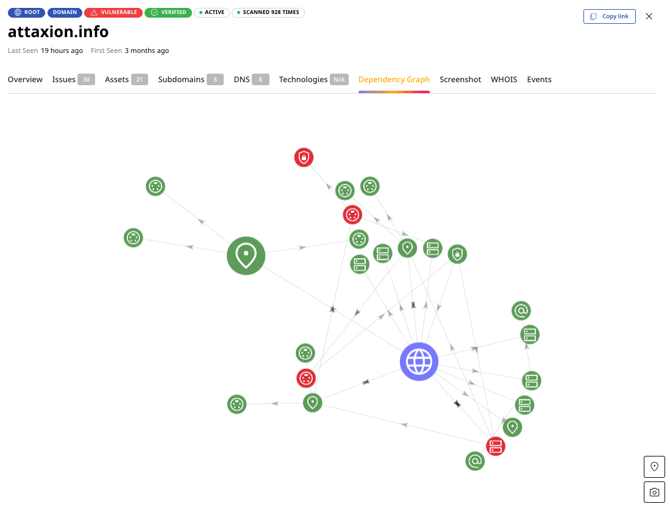
A dependency graph shows assets that are dependent on the asset in question. For most assets, it’s going to be empty, because they are the final link in the chain and no assets depend on them.
But for some, the dependency graph shows a graph of dependent assets, with healthy assets painted green, and vulnerable assets painted red.
Events
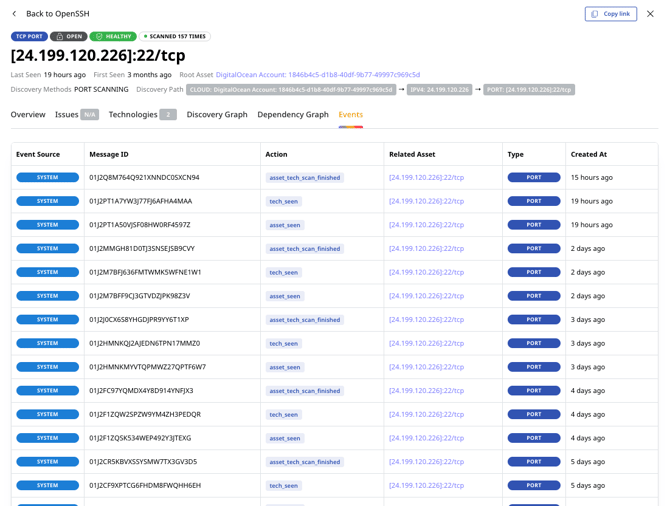
The “Events” tab shows you a list of system events that can give you an idea about Attaxion’s interactions with the asset.
For instance, it can show you that an asset has been seen and scanned, that certain technologies associated with it have been seen, or if a scan or some reconnaissance technique failed.
Tabs Specific for Some Asset Types
Discovery Graph
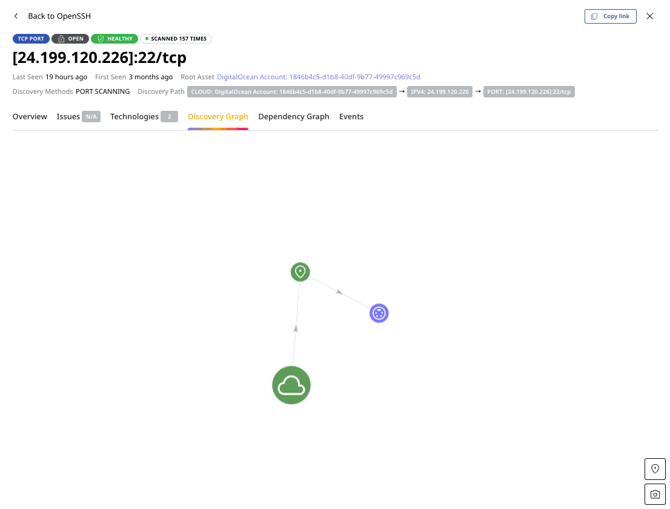
Discovery graph is available for non-root assets only.
This tab shows you a graph with a discovery path from the related root asset to the asset in question. It consists of other assets and allows you to reveal possible attack paths.
Assets
The “Assets” tab is available for Domains, CIDRs, and Clouds. It lists all the IP addresses and that belong to a CIDR or all possible assets associated with a cloud instance.

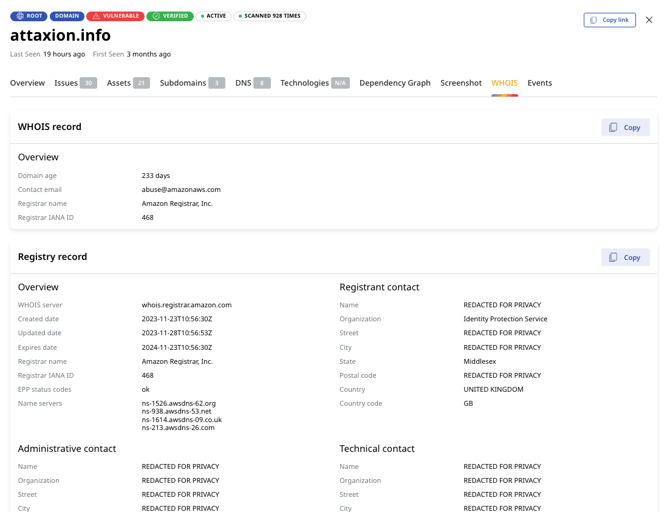
WHOIS
The “WHOIS” tab is available only for domains. It provides data from a WHOIS record and a registry record associated with the domain in question.
Screenshot
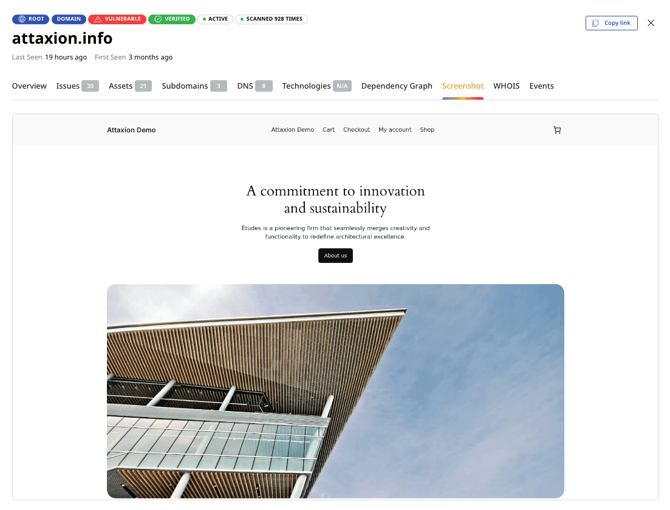
The “Screenshot” tab is available for domains and IP addresses only.
It provides a screenshot of a website that corresponds to this domain name or IP address.
Subnetworks
The “Subnetworks” tab is only active for IP addresses. It provides information about the IP ranges associated with this IP address.

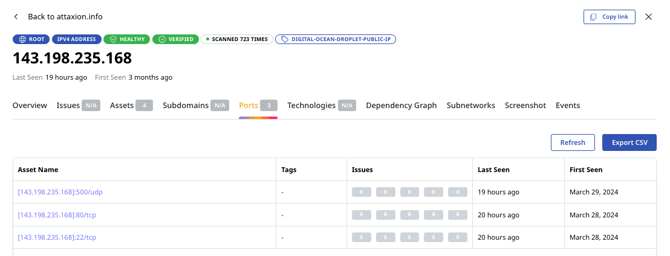
Ports
The “Ports” tab is available only for IP addresses. It provides a list of open ports associated with this IP address. If you click on a port from the list, an “Asset details” view for this port will open.
Subdomains
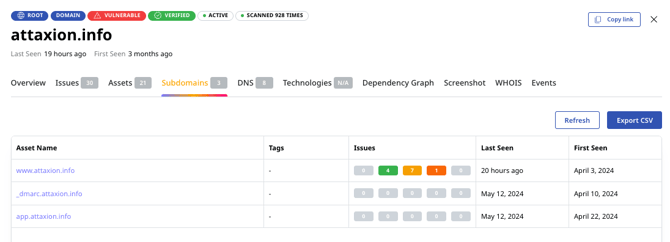
The “Subdomains” tab is available only for CIDRs and domains.
It lists the subdomains related to the asset in question, providing a quick overview of the issues that they have.
DNS
The “DNS” tab is available for domains only.
It provides information about DNS records associated with this domain name.
