The “Network Traffic” Tab Explained
The optional Network traffic tab provides a detailed view of network communications between your infrastructure and external IPs, highlighting traffic to and from IPs with a bad reputation.
In the menu on the left, under "Monitoring", you can find two tabs — “Network traffic” and "Indicators of Compromise (IoCs)." The first one is dedicated to Attaxion’s optional Agentless Traffic Monitoring feature. This feature is not enabled by default, but you can request access from the sales team.
It helps you understand how assets within your infrastructure interact with external IP addresses on the internet.
What Is There in the “Traffic” Tab?
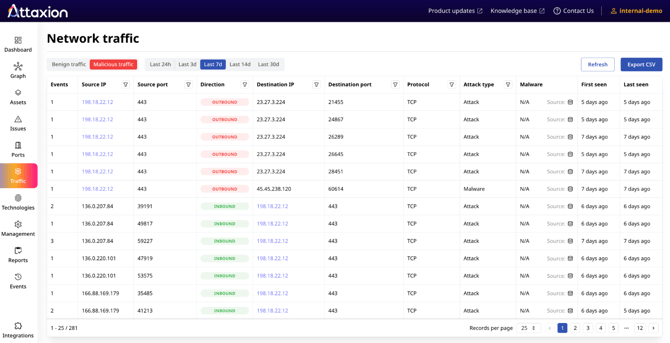
When you click Monitoring in the menu on the left, and then select "Network traffic", you will see a table summarizing NetFlow data that shows communication events between IPs in your infrastructure and external IPs.

At the top of the page, you can filter what traffic is displayed:
- Benign/Malicious: Switch between displaying communications with IPs that are not known to be malicious and those flagged as malicious in the connected threat intelligence feeds.
- Time Range: Choose to display traffic data from the last 24 hours, 3 days, 7 days, 14 days, or 30 days.
The tab displays the unique pairs of communications between an IP belonging to your infrastructure and an external IP on the internet. It offers the following data:
- Events – The total number of communication instances detected between your infrastructure IP and the given external IP.
- Source IP – The originating IP address (within third party infrastructure for inbound and your infrastructure for outbound traffic).
- Source Port – The port number used by the source.
- Direction – Whether the traffic is inbound (coming into your infrastructure) or outbound (going out from your infrastructure).
- Destination IP – The IP address being communicated with (within your infrastructure for inbound and third party infrastructure for outbound traffic).
- Destination Port – The destination port number.
- Protocol – The communication protocol (e.g., TCP, UDP).
- First Seen – The timestamp when this communication was first observed.
- Last Seen – The most recent timestamp when the communication occurred.
For malicious traffic, it offers additional data:
- Attack type – Details on what kind of attack the malicious IP is associated with (e.g., malware, phishing, etc.), if available from connected threat intelligence feeds.
- Malware – The specific malware family the malicious IP address is known to be related to (if available in the threat intelligence feeds).
You can filter the data using the funnel icons next to fields such as Source Port, Destination Port, Source IP, and Destination IP. Use the “Export” button on the right to generate a CSV file of the currently displayed data.
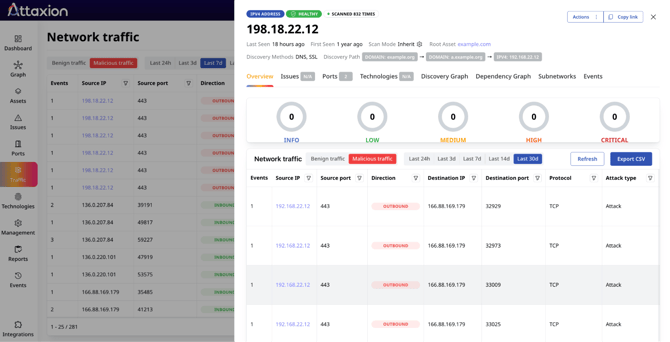
Clicking on the IP addresses belonging to your infrastructure displays the “Asset Details” view with the addition of the traffic tab that shows all detected traffic to and from this asset.

What Can You Do From the “Traffic” Tab?
The Traffic tab is designed to help you analyze, investigate, and act upon observed communications.
From there, you can review the overall traffic activity of the IPs within your infrastructure and identify communications with IPs that have bad reputation. You can use this information to kick off threat hunting exercises or prioritize patching assets that have high-severity vulnerabilities and are seen communicating with known malicious IPs.