If you have an MSSP partner agreement with Attaxion, you can access the Attaxion MSSP admin panel by logging into your account at mssp-admin.attaxion.com with your Attaxion credentials. There, you’ll see a dashboard where you manage all your clients and their external attack surfaces.
What’s There in the MSSP Dashboard?
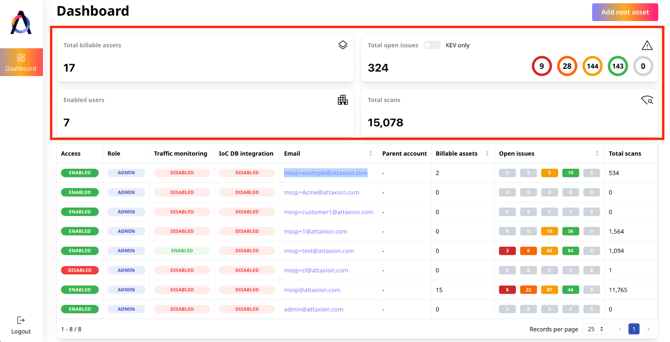
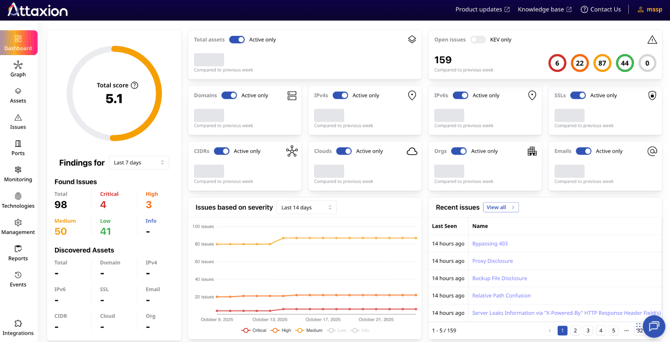
One of the first things you will see in the MSSP dashboard is an overview widget that provides the following information:
- Total billable assets: This represents the total count of all assets that you, as an MSSP, are paying for on behalf of all your clients.
- Enabled users: The number of users in your Attaxion MSSP environment who have Attaxion accounts and their own external attack surfaces.
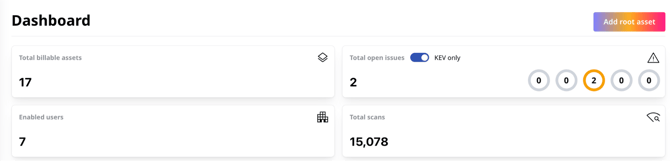
- Total open issues: The total number of security issues for all clients combined. You can toggle the “KEV only” radio button to only show issues found in the CISA’s Known Exploited Vulnerabilities (KEV) catalog.
- Total scans: This shows the number of times Attaxion has scanned the assets of all your clients.
The breakdown per client for all those stats above is shown in the table below the overview.
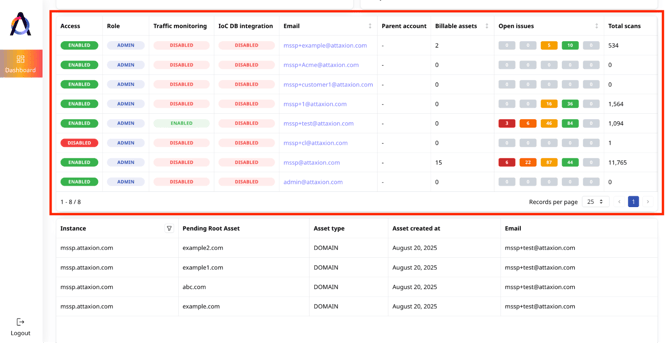
From that table, you can see which users have their Attaxion access enabled, their role, email addresses, parent account (if any), and billable assets per client. You can also see the distribution of each client’s open issues by severity, as well as the total number of scans per client.
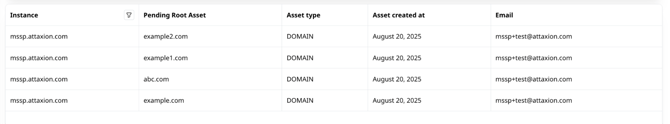
Below, there’s another table listing all root asset candidates that have been discovered for your clients and are awaiting approval.
What Can You Do From the MSSP Admin Panel?
Manage Users
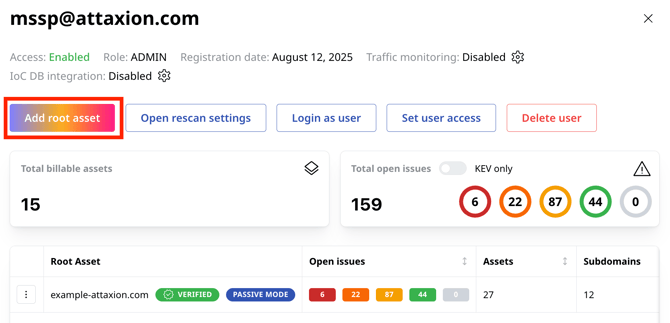
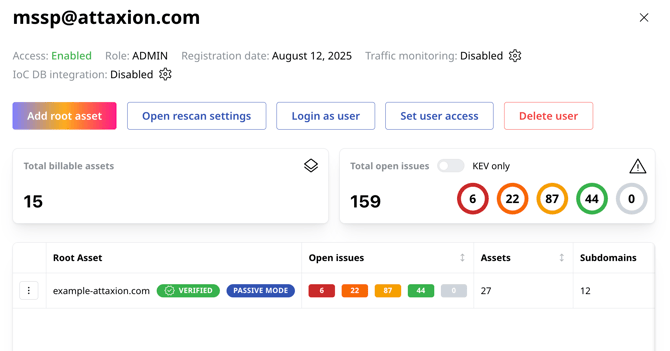
The panel is where you can manage all users. To start, click on the email address of a specific user from the table. The “User details” view will open on the right, where you will immediately see the status of the user’s access (enabled or disabled), their role, and registration date. You can revoke the user’s access by clicking on the “Set user access” button.
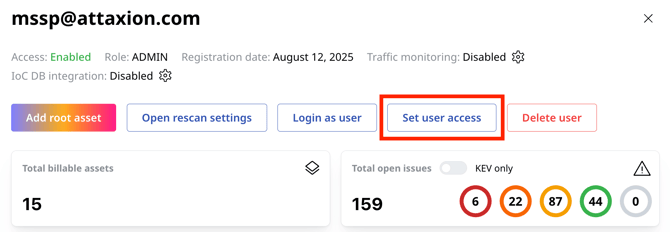
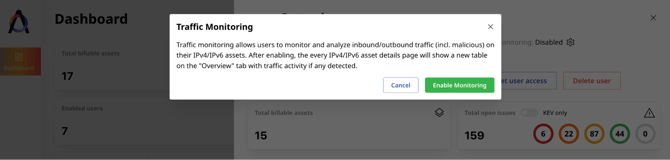
You can also see if Malicious Traffic Monitoring and IoC Database Monitoring are enabled or disabled for the client. Click on the cog icon next to the respective feature to enable or disable the feature for the client.
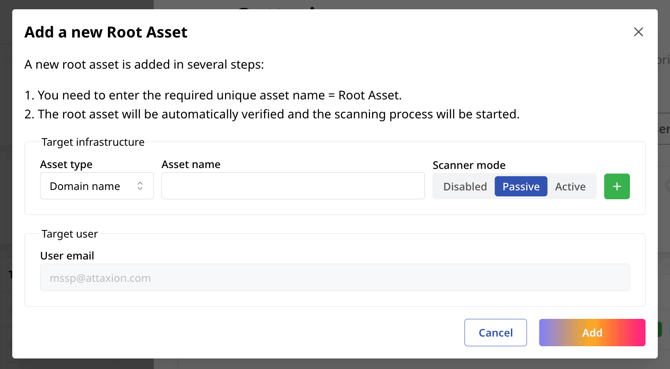
You can add root assets for the client from the “User details” window by clicking on the “Add root asset” button.
On the form that appears, select the asset type (domain, IPv4 or IPv6 address, CIDR, or organization) and scanner mode, and enter the asset name. Clicking on “Add” automatically verifies the root asset, and it will be scanned immediately.
You can add multiple root assets at once by clicking the green plus button on the right and adding the same details for another root asset.
The root assets for that client are listed in the “User details” window. You can see the number of open issues Attaxion found for that particular root asset and the number of assets and subdomains related to it.
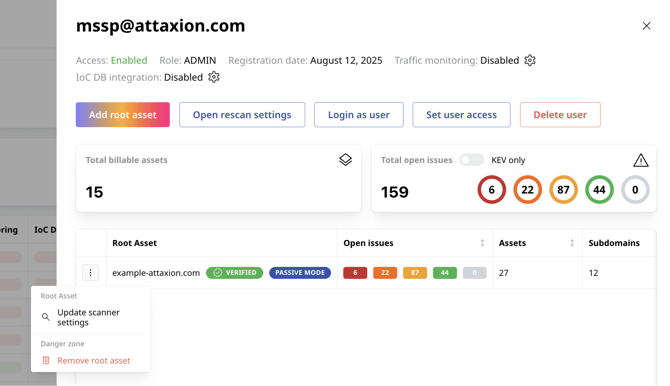
Clicking on the hamburger menu icon on the left side of the root asset name lets you update the scanner settings or remove the root asset.
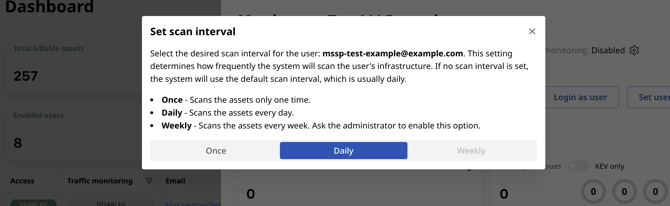
From there, you can also change the scanning frequency of the user’s infrastructure to once (scanning is only done one time), daily, or weekly. Take note that only an administrator can enable the weekly scan option.
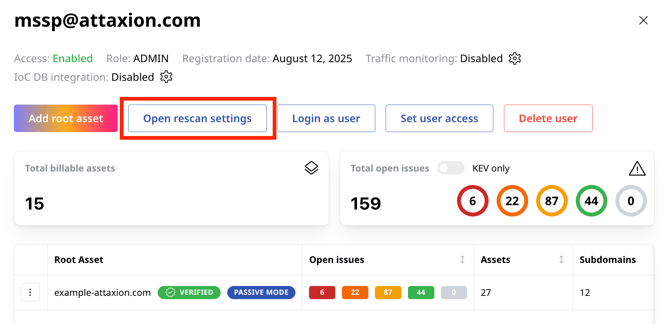
You can initiate rescans of the client’s assets by clicking on the “Open rescan settings” button. Note that the previous scan data will be deleted if you do so.
Log In as User
On the “User details” window, you can see a button that says “Log in as user.” This lets you see and manage the client’s attack surface directly from their Attaxion interface.
Here, you can switch between different tabs from the menu on the left and use Attaxion as a regular user would.